|
We have this amazing picture of the ocean, atmosphere, and ice going from the fully frozen period in March to meltdown and breakup right through to freeze-up in early autumn. |
|
|
|
Martin Jeffries & Scott Harper Discuss Program Motivations |
||

Martin Jeffries & Scott Harper Discuss Program Motivations |
The Arctic and Global Prediction program is ONR's response to the Navy's need for more research into understanding the environment and expanding our predictive capabilities. |
|
Overview |
|||||||
|
Recent decades have seen pronounced Arctic warming accompanied by significant reductions in sea ice volume and a dramatic increase in summer open water area. The resulting combination of increased ice-free area and more mobile ice cover has led to dramatic shifts in the processes that govern atmosphere–ice–ocean interactions, with profound impacts on upper ocean structure and sea ice evolution. The summer sea ice retreat and resulting emergence of a seasonal marginal ice zone (MIZ) in the Beaufort Sea exemplifies these changes and provides an excellent laboratory for studying the underlying physics.
|
|
Science Objectives |
Technical Objectives |
|
|
|
|
Current Array Position |
Current Array Data |
|
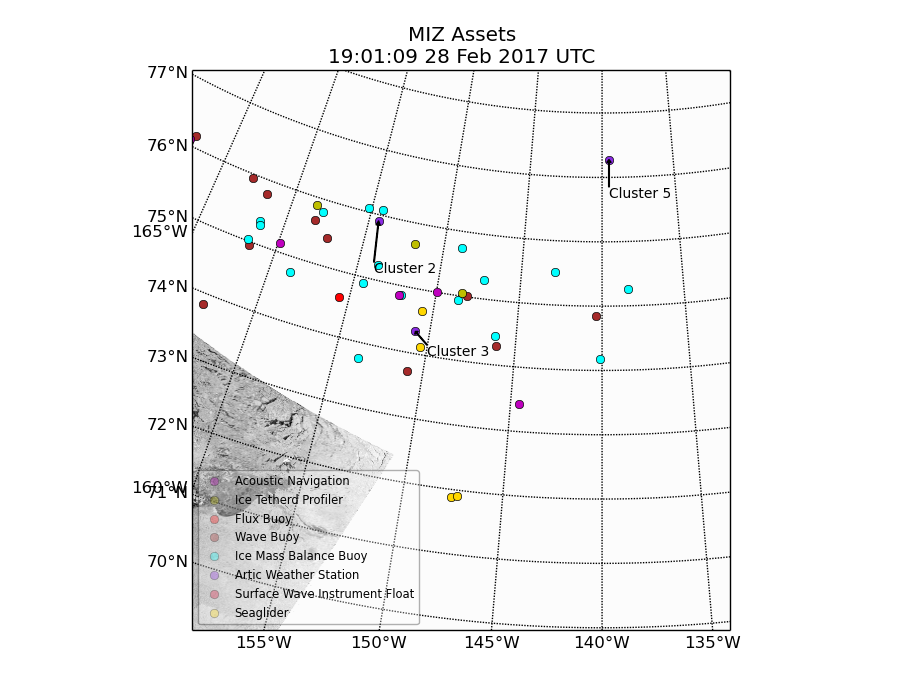
|
Cluster 4 
Cluster 3 
Cluster 2 
|
|
|
|
Large Scale MIZ Evolution |
|
Radarsat II, ScanSAR Wide 500 km x 500 km scene, ~100-m resolution, dual-polarization when available (HH,HV) 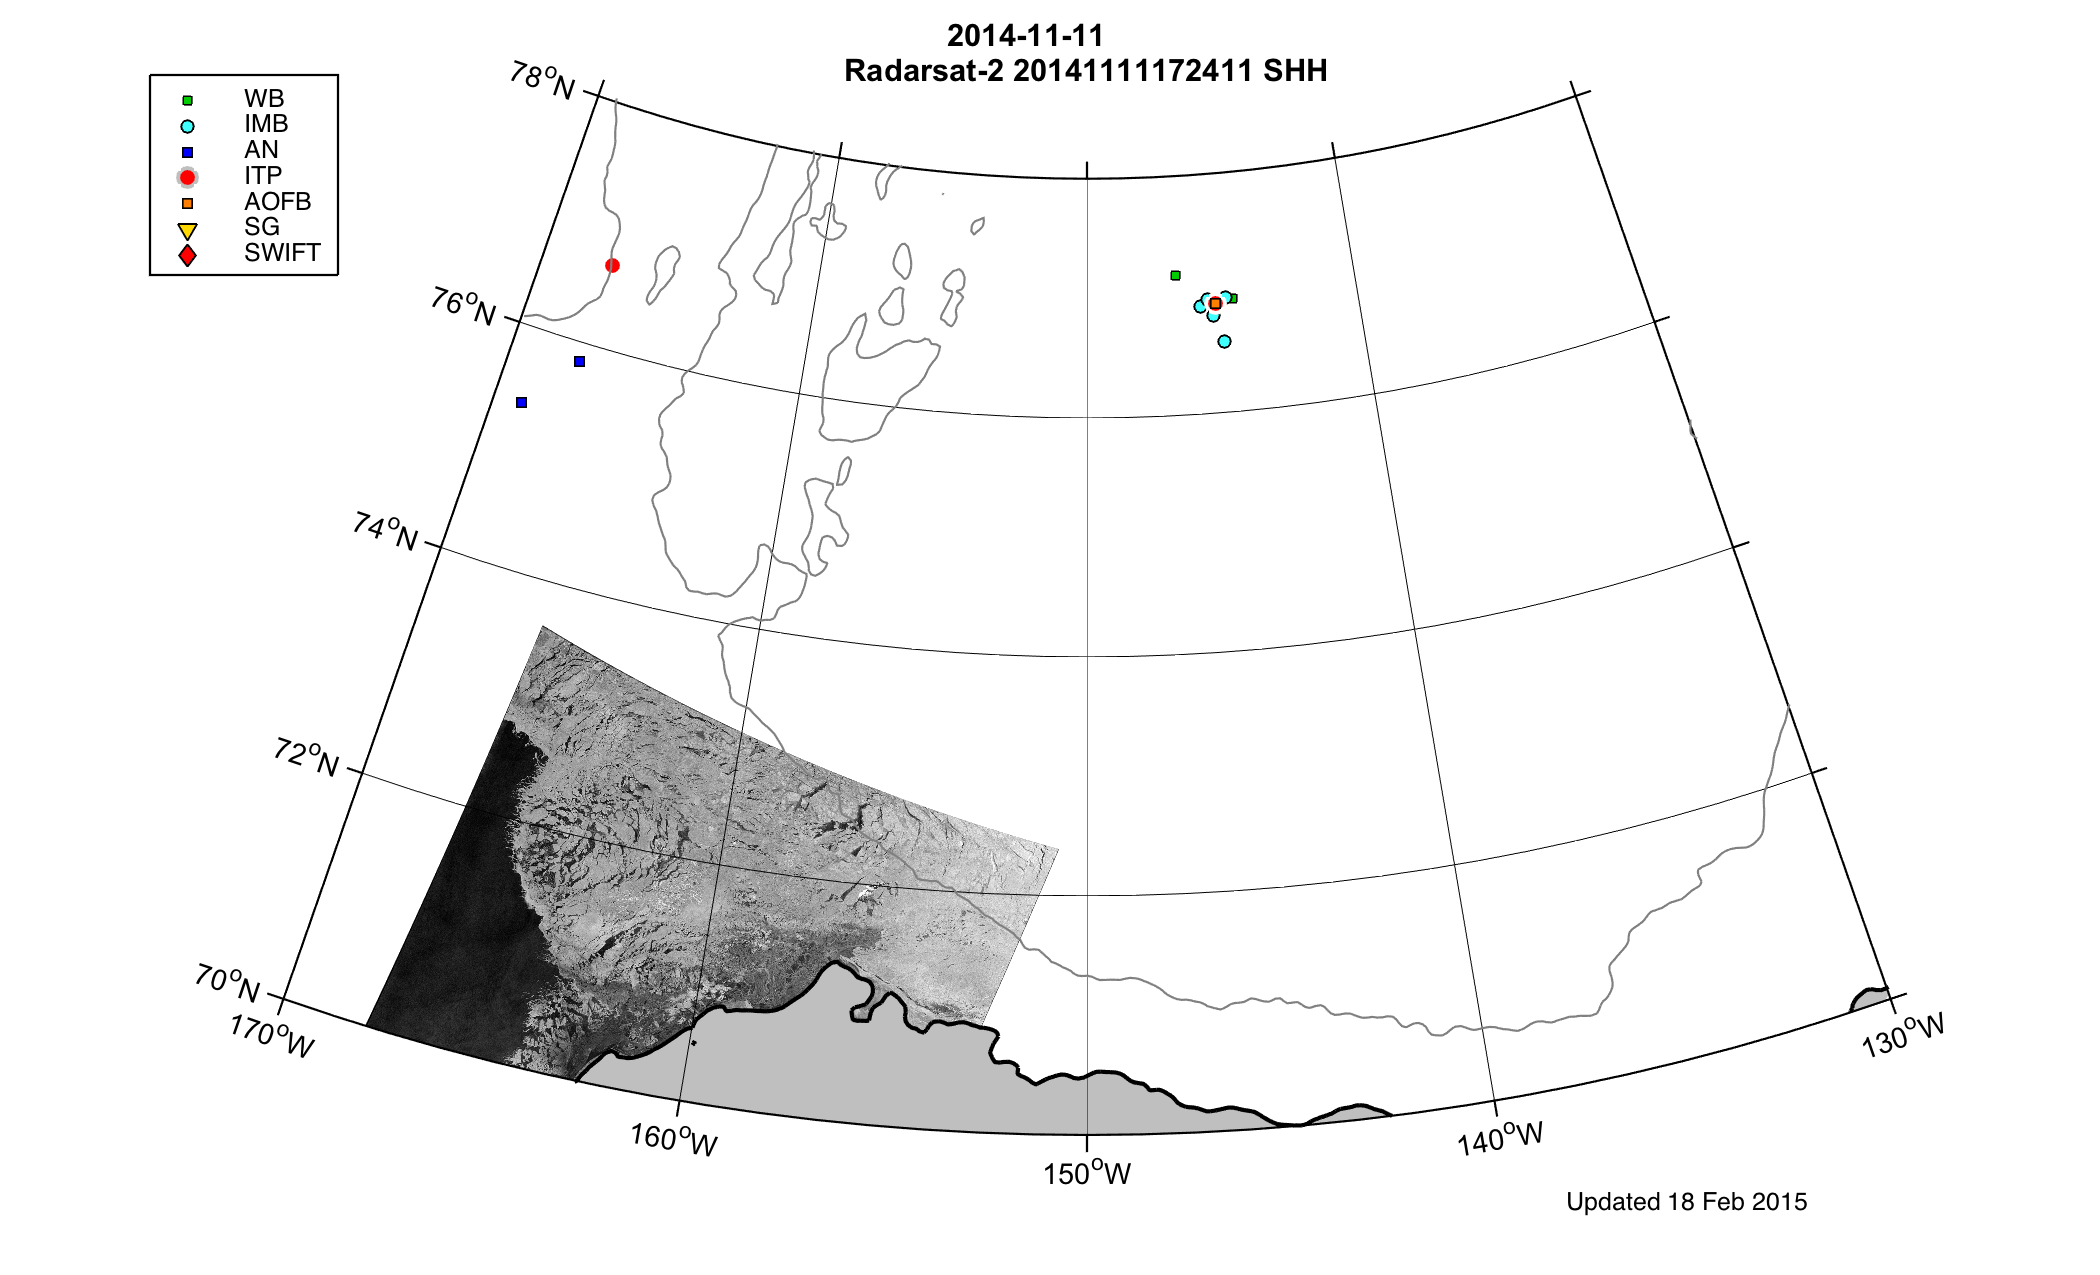
Latest Radarsat-2 image |
|
Buoy Clusters |
|
TerraSAR-X, Single-Polarization StripMap 30 km x 50 km scene, 4-m resolution (HH) |
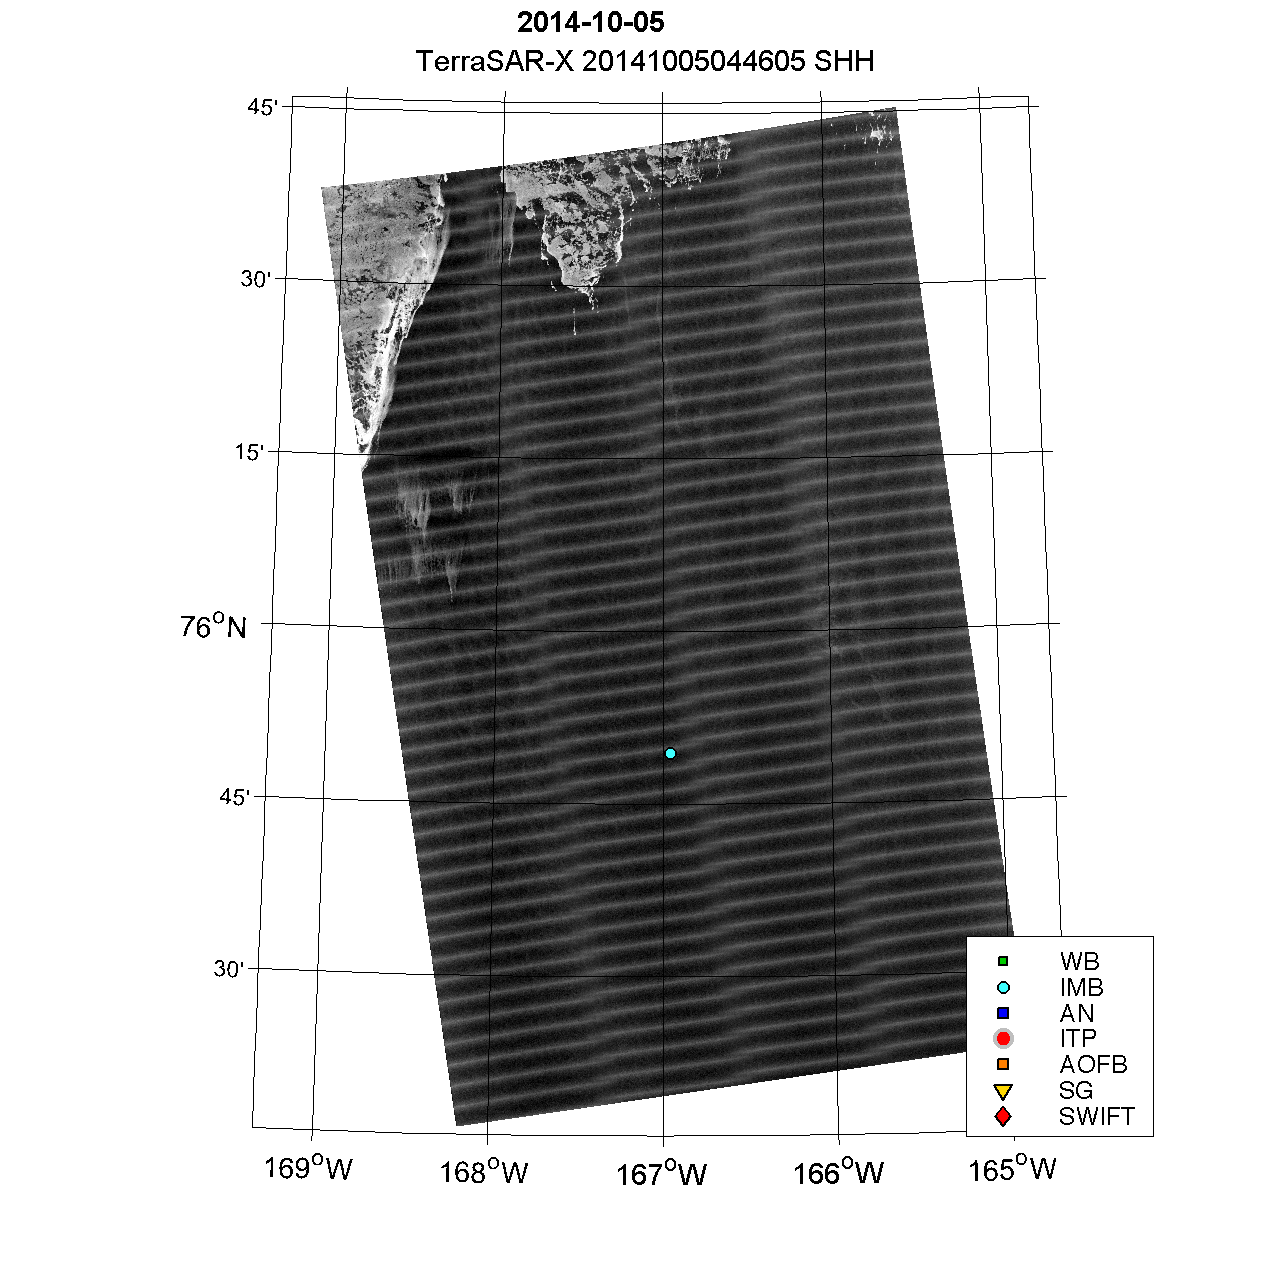
Latest image of Cluster 1 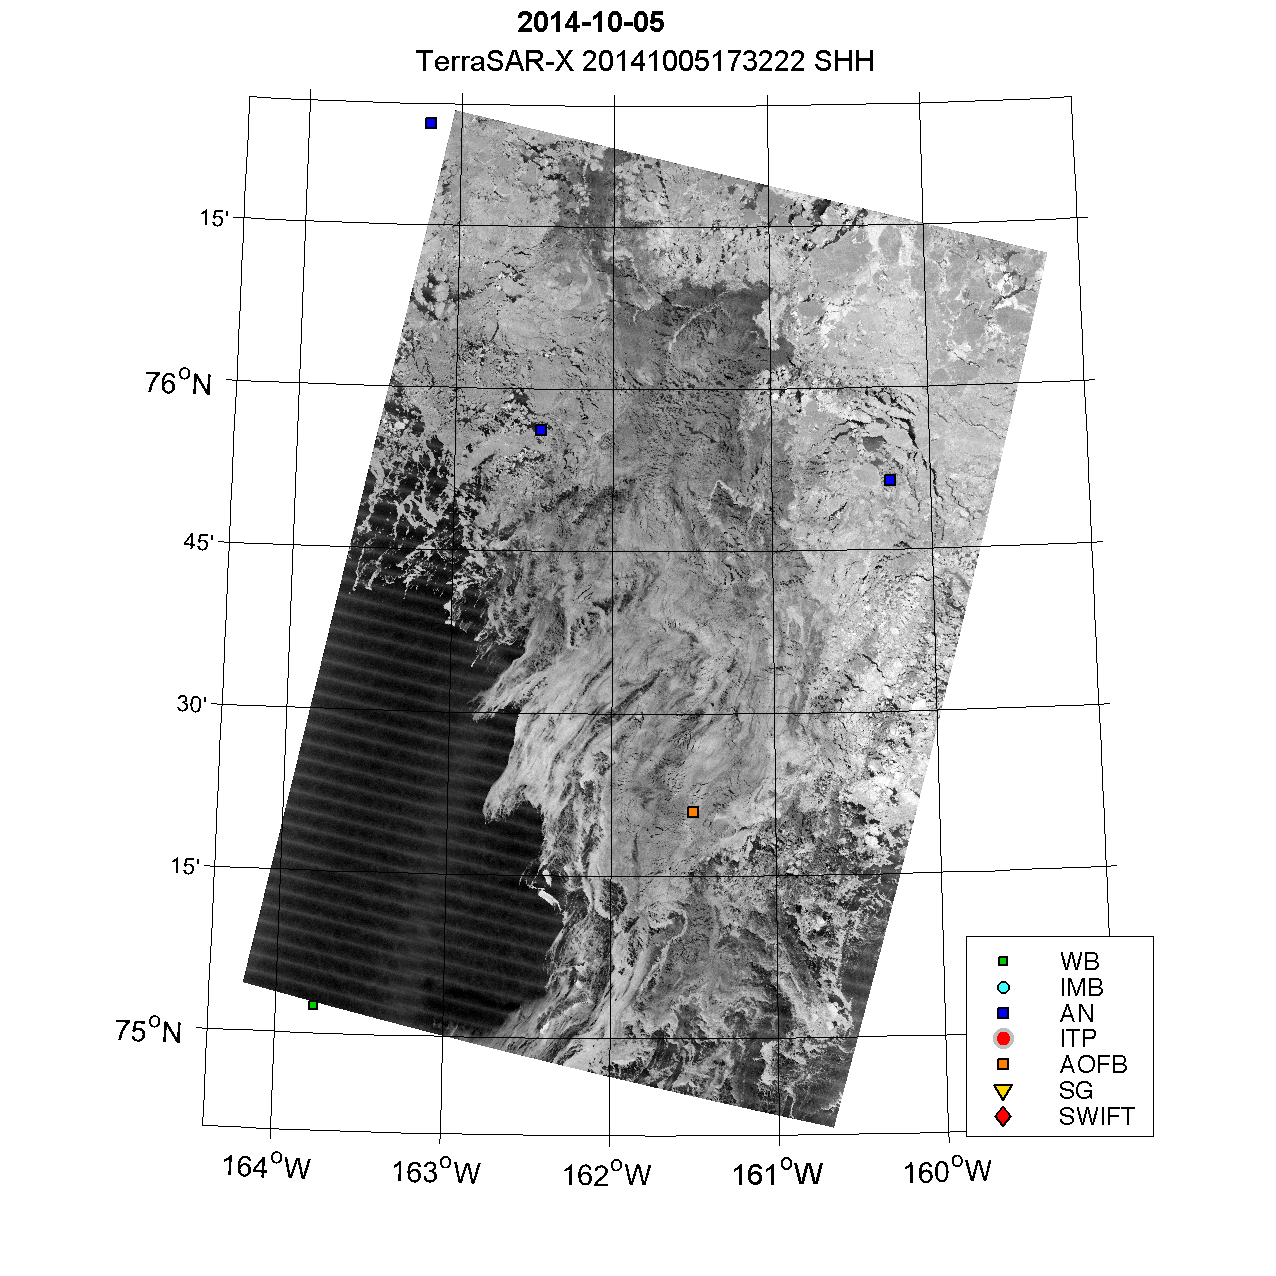
Latest image of Cluster 2 |
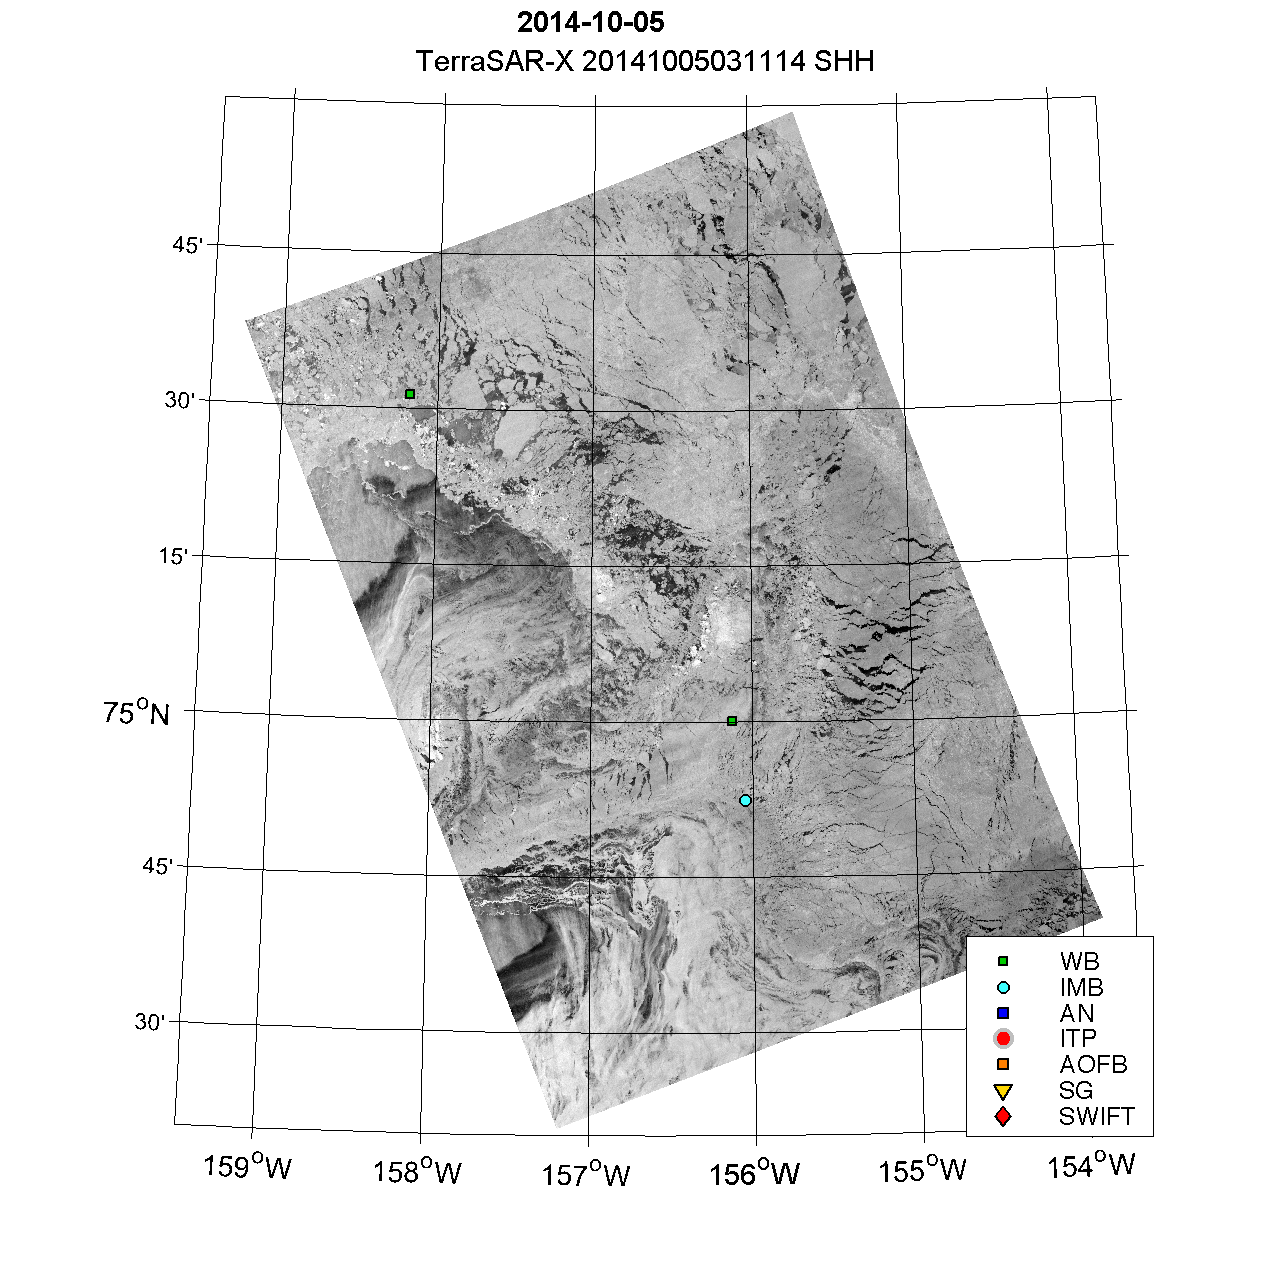
Latest image of Cluster 3 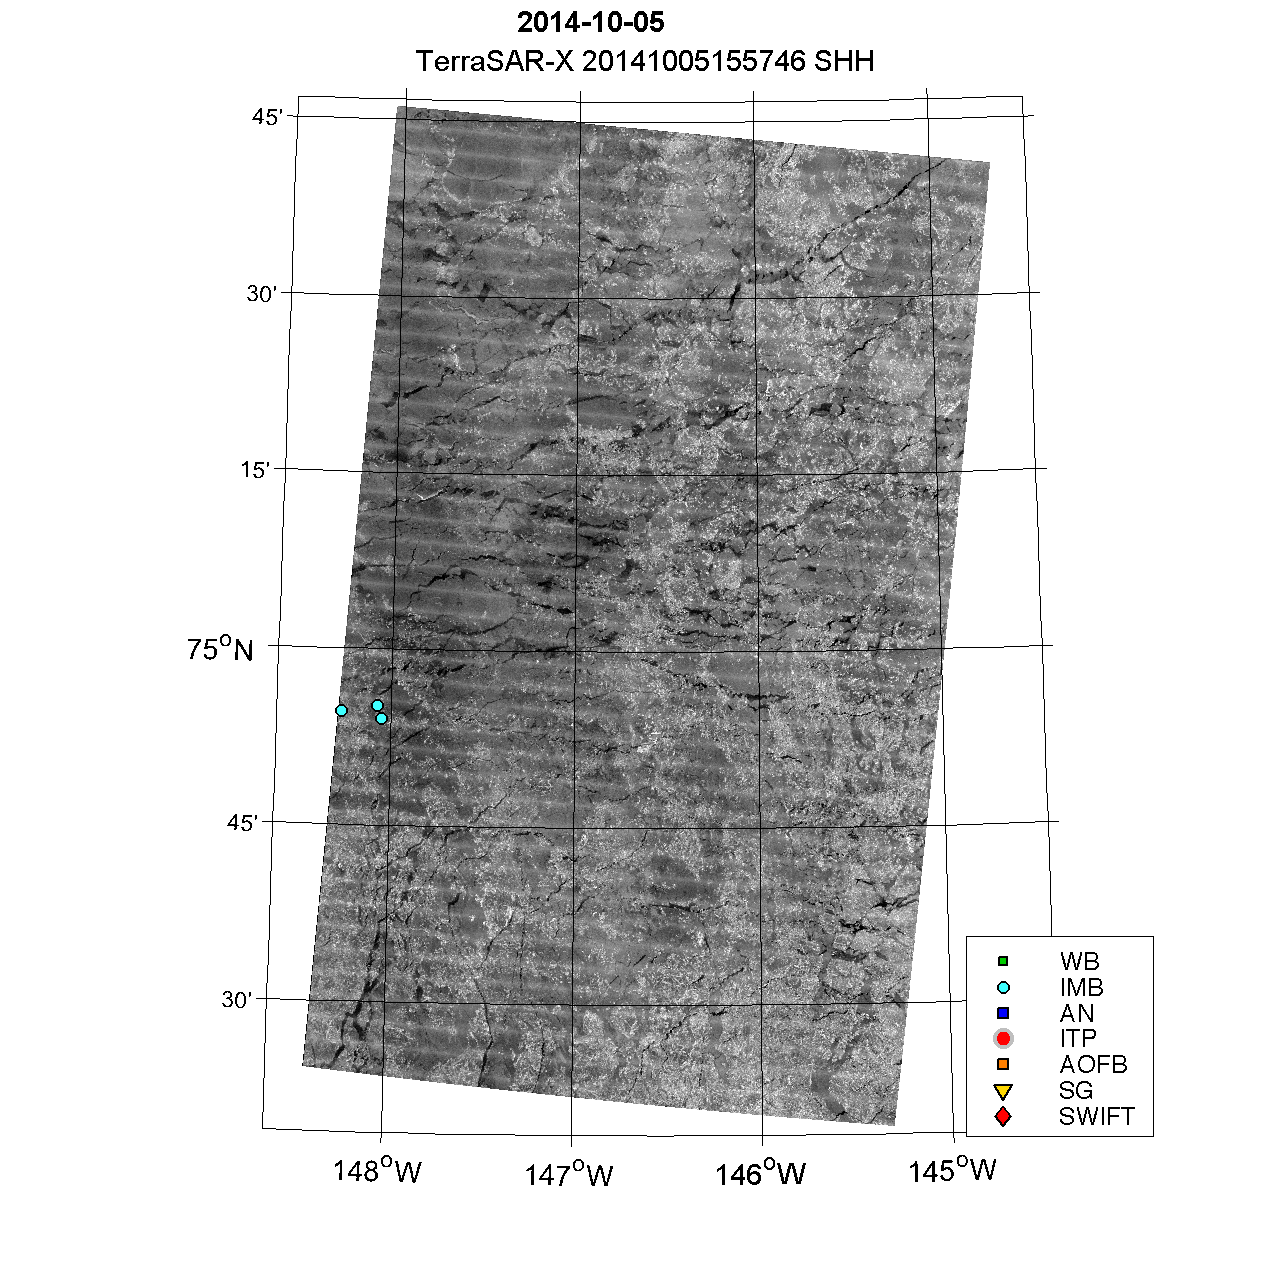
Latest image of Cluster 4 |
|
Data Description A document including a detailed description of the imagery collected and instructions for obtaining full-resolution images from the CSTARS is available to the project's Principal Investigators in the Collaboratory. |
|
Visible Images |
|
High-resolution visible images (18 km x 18 km, ~ 1-m resolution) are being collected by MEDEA to monitor ice conditions in the immediate neighborhood of the buoy clusters and the BGEP A and D moorings. These background images are collected every three days through the height of the melt season (July–Sep) and collected every seven days prior to this. The visible images will be available on the USGS Global Fiducial Library once they are approved for public release. |
|
ITP |
|
Data from all Ice-Tethered Profilers with Velocity (in near-real time) |
|
AOFB |
|
Data from all Autonomous Ocean Flux Buoys (in near-real time) |
|
SWIFTs |
|
The Surface Wave Instrument Float with Tracking — SWIFT — is a free-drifting system to measure waves, winds, turbulence, and ambient noise at the ocean surface. |
|
IMB, WB, and AWS |
|
Public data will be available soon. |
|
Atmosphere–Ice Coupling in the Evolving MIZ |
||
|
One of the more obvious impacts of the changes in ocean–ice–atmosphere interaction in the Beaufort and Chukchi seas region has been the expansion of a MIZ; a long-standing feature in the Bering and Chukchi seas, but a relatively new phenomena in the deep Beaufort Sea. In the western Arctic, the northward retreat of the sea ice edge increases the open water area, allowing direct momentum transfer from the atmosphere to the ocean surface through wind-driven waves. The resulting fragmented ice field has different surface roughness features, and because the smaller floes are significantly more mobile, sea ice can absorb more atmospheric surface stress through deformation and transfer it to the ocean surface. More efficient atmosphere–ocean coupling in regions of partial ice cover and open water can amplify upper ocean mixing far beyond levels observed under full ice cover. As in the open ocean, strong winds acting on ice-free regions of the Arctic will drive turbulent mixing that deepens the surface mixed layer, entraining waters from below. Because the sea ice cover moderates atmosphere–ocean fluxes and the ocean affects the ice cover through fracturing, divergence, and melting, the ice–ocean system is strongly coupled within the MIZ.
|

Atmosphere, ice, and upper ocean processes in the MIZ. Ice cover modulates penetration of solar radiation and isolates the upper ocean from direct wind forcing, but increasing open water within the MIZ, and the proximity of large expanses of open water immediately to the south, permits more direct connection with the atmosphere. Strong open water swell and surface wave activity attenuates as it enters the MIZ. Likewise, internal waves, submesoscale eddies, and mixing weaken with increasing ice cover. Small-scale windstress curl associated with ice to open water transitions and variations in ice roughness may induce intense secondary circulations that drive rapid vertical exchange. Enhanced mixing and vertical exchange can entrain heat stored below the mixed layer, increasing basal melting of sea ice within the MIZ. In ice-covered regions, local radiative solar warming leads to direct ablation of sea ice and some bottom melt from the radiation penetrating weakly into the ice-covered upper ocean. Open water regions within and south of the MIZ allow increased radiative upper ocean warming and, through lateral advection, accelerated ice melt. These processes are expected to amplify variance at short spatial and temporal scales across the MIZ. |
|
Summer Ice Retreat and Opening of the Beaufort Sea |

SSM/I ice cover for April, June, and August (top, middle, and bottom) for 1990 (left) and 2012 (right). Prior to the recent period of sea ice decline, the MIZ rarely extended beyond the Alaska slope. More recently, the seasonal MIZ develops in July and retreats rapidly northward, leaving large expanses of open water over the Alaska slope and into the deep Beaufort Sea. |
|
Field Program |
Observing Array Assets and Configuration |
|
|
The MIZ intensive field program will employ an array of cutting-edge autonomous platforms to characterize the processes that govern Beaufort Sea MIZ evolution from initial breakup and MIZ formation though the course of the summertime sea ice retreat. The sampling goal is to achieve a deployment of ice-based platforms arrayed around a line that stretches northward approximately 400 km from the Alaska slope (roughly 70°–76°N at 140°W) on 1 July. Ice-based instruments include arrays of Ice Mass Balance and Wave Buoys (IMB/WB), Autonomous Weather Stations (AWS), Ice-Tethered Profilers (ITP), and Autonomous Ocean Flux Buoys (AOFB). An array of drifting and mobile autonomous platforms will operate within the matrix of ice-based instruments. Polar Profiling Floats (PPF) will be deployed at locations spanning the entire line to provide daily profiles of temperature and salinity. Surface Wave Instrument Floats with Tracking (SWIFT) drifters and Waverider Buoys will be deployed in open water, near the MIZ, shortly after its formation, and may be recovered and relocated during the melt season. Two Liquid Robotics Wavegliders will follow the northward sea ice retreat, maintaining position close to the ice-based instruments nearest the ice edge, to provide additional acoustic navigation signals, open water measurements, and boundary layer meteorological measurements within the open water south of the MIZ. Lastly, autonomous Seagliders will follow the retreating ice edge, occupying sections that span open water, the MIZ, and full ice cover to document upper ocean evolution as a function of distance from the ice edge throughout the entire northward retreat. These high-resolution sections will bridge the regions between observations collected by the ice-based and drifting platforms, provide spatial context, and bind the array together. |

Idealized (target) configuration of the MIZ DRI observing array. The actual array will deform as it drifts westward through the region. Note the markers indicating various instrument separations (drawing is not to scale). Ice-based instruments will melt out from the south as the MIZ retreats northward. Blue, double-ended arrows mark glider sections that will follow the northward retreat of the sea ice to remain centered on the MIZ. Solid (dashed) light blue lines mark notional positions of the ice edge in June, (July, and August) relative to the observing array. By August, the MIZ is far to the north and much of the ice-based instrumentation has melted out. |
|
Modeling |
Sub-array Assets and Configuration |
|
|
High-resolution modeling of the MIZ in the Chukchi and Beaufort seas will be conducted using three distinctive models targeting various key MIZ processes. The Marginal Ice Zone Modeling and Assimilation System (MIZMAS) model will be used to simulate the evolution of ice thickness and floe size distributions jointly in the MIZ. The MIZMAS model will be used for hindcast, seasonal ensemble forecast, and future projection of the MIZ. The Arctic Cap Nowcast/Forecast System (ACNFS), developed at the NRL, will be used for nowcasts and 5-day forecasts of ice thickness, ice drift, ocean currents, salinity, and temperature fields. The Eddy-resolving Regional Arctic Climate System Model (E-RASM) is a fully coupled model including atmosphere, land hydrology, ocean, and sea ice components. The model will be used to examine the critical physical processes and atmosphere–ocean–ice feedbacks that affect sea ice thickness and area distribution using a combination of forward modeling and state estimation techniques. |

Ice-edge and ‘5-dice’ IMB/WB sub-array configuration, depicting oceanographic sampling by floats and gliders beneath the ice and by various ice-based instruments that penetrate through the ice. Gliders conduct sections that extend from full ice cover, through the MIZ, and into open water. Wavegliders and SWIFT drifters sample within the MIZ and the open water to the south. |
|
Ice Mass Balance Buoys, Wave Buoys, and Automated Weather Stations |
Autonomous Ocean Flux Buoys |
Ice-Tethered Profilers |
||
|
Wilkinson, Maksym, Hwang, Wadhams, and Doble Autonomous instruments will monitor four parameters continuously:
Ice mass balance (IMB) + wave buoy (WB) Inference of ice growth or melt at the surface and bottom of the sea ice depends on accurate localization of the ice–ocean interface, which in the case of IMB buoys, relies on measurement of both the ambient temperature and the thermal response of the immediate surroundings of the heater/sensor pairs to short periods of heating, i.e., the temperature elevation above ambient. The thermal response of air, snow, ice, and water to this heating cycle is different, and thus the medium the sensor is embedded in can be recognized. Once the interfaces have been identified the rate of change in the position of the interface along the chain is interpreted as the melt rate. Generally an IMB chain is 5 m long with temperature sensors spaced at 2 cm along its length. This allows a portion of the chain to sample the ambient air, snow, ice, and upper water column temperature. The IMB/WB will be a float, and thus will continue to obtain important data on the evolution of the upper ocean heat and the ocean wave spectra. The background open ocean spectra will be used in conjunction with buoys that are still in the ice to quantify wave attenuation rate. The open water spectra are an important part of the process and therefore Wavegliders should also be deployed in the open water near the ice edge. Automated Weather Station (AWS) AWS installations measure GPS location, wind speed and direction, humidity, air temperature, pressure, solar radiation, and floe rotation. All platforms take advantage of solar power and the two-way communication offered by Iridium. This allows batteries to be recharged and users to alter, when required, the sampling rate remotely. All transmitted data will be piped directly to the Global Telecommunications System (GTS). These data will then be available to numerical weather prediction centers in near-real time. High-resolution satellite imagery will be acquired to obtain co-incident information on the open water fraction and floe size distribution within the area of the buoy arrays and from the ice edge northwards along the buoy deployment line. Analysis of these images will enable us to quantify the continuous evolution of sea ice conditions (open water fraction, floe size distribution, and MIZ width) with respect to the in situ parameters that are measured by the buoys. The principle satellite sensor will be the SAR TanDEM-X (TDX), successor of TerraSAR-X, as it can provide all-weather, high-resolution images (3–18-m pixel size) at reasonable cost. |
Stanton and Shaw Autonomous Ocean Flux Buoys will quantify vertical turbulent fluxes from the spring formation of the MIZ through the summertime sea ice retreat. After field installation, AOFBs maintain twice-daily, two-way communications with a computer running at the NPS allowing transmission of the full data timeseries and routine updates of sampling parameters. The buoy system has a hull and floatation system capable of surviving multiple melt-out and refreeze events. 
The Naval Postgraduate School (NPS) Autonomous Ocean Flux Buoy (AOFB). A surface buoy sits on the ice supporting an instrument package suspended into the upper ocean by a series of poles from the bottom of the surface buoy. The surface buoy contains processing electronics, GPS and Iridium antennae, and batteries. The instrument package is outfitted with a downward looking 300-kHz Acoustic Doppler Current Profiler (ADCP, RDI Workhorse) and a custom-built flux package. Additionally, the buoys have GPS receivers for measuring position and calculating ice velocity. After installation in the field on selected ice floes, AOFBs maintain twice-daily, two-way communications with a computer running at the NPS. |
Toole, Krishfield, Timmermans, Cole, and Thwaites An array of four autonomous Ice-Tethered Profilers with velocity (ITP-V) will quantify the seasonally varying upper ocean stratification and velocity field, and the turbulent ice–ocean exchanges of heat and momentum in the Arctic MIZ. The ITP-Vs will sample through the melt season to follow mechanical displacements of the ice as the ice edge sweeps north. 
Schematic of the WHOI Ice-Tethered Profiler system (left), the profiler with velocity sensor (ITP-V) prior to deployment (upper right), and the surface expression (lower right). |
|
Autonomous Gliders |
Polar Profiling Floats |
Acoustic Navigation Array and Wavegliders |
||
|
Lee, Rainville, and Gobat Four Seagliders will repeatedly occupy sections centered on the MIZ, following its northward retreat. Two gliders will occupy short lines (~50 km) designed to resolve short time scale variability about the MIZ itself, while the other two will conduct longer surveys (>150 km) that extend beyond the influence of the MIZ in both the open ocean and ice-covered directions.

The Mobile MIZ Observing Network. Ice-Tethered Profilers, ice-capable Seagliders, and profiling floats, with an acoustic array providing under-ice geolocation and navigation, provide high spatial and/or temporal resolution ocean measurements in the MIZ. The array follows ice drift and retreat though the melt season. Gliders sample from open water, through the MIZ, and into full ice cover, profiling from the ice–ocean interface to 1000 m depth. |
Owens and Jayne Twelve WHOI polar profiling floats will be deployed as part of the MIZ observing system. These floats will carry a WHOI micro-modem capable of receiving the signals from the mid-frequency, 780-Hz sound sources that will allow geopositioning during the initial part of the observational period, when the floats profile entirely in ice-covered waters. During the later stages of the experiment, when the region is relatively ice-free, floats will use GPS for positioning. The floats will provide 1-m bin-averaged temperature and salinity profiles from the bottom of the ice or 1 m from the sea surface to 1000 m depth on a daily schedule during the intensive observational period. At the end of the experiment, the floats will change to a 10-day repeat and report their data through the Argo float program. |
Freitag An array of at least eight ice-tethered acoustic navigation sources will be deployed in two meridional lines running parallel to the main IMB/WB/ITP array. An additional pair of sources will be carried by two Liquid Robotics Wavegliders. The two Wavegliders will also be instrumented with meteorological sensors to characterize atmospheric forcing over the open water south of the MIZ. The array of sources provides a drifting acoustic navigation network for gliders and floats operating beneath the ice. |
|
Wave and Current Meters |
||||
|
Thomson Three instruments will capture the temporal evolution and spatial variation of waves in the MIZ. Two sub-surface moorings equipped with Nortek Acoustic Wave and Current (AWAC) meters will be deployed. Two surface Waverider buoys will be deployed in open water at the southern edge of the MIZ to provide a boundary condition for wave measurements collected by drifters deployed within the MIZ. Six Surface Wave Instrument Float with Tracking (SWIFT) drifters will be deployed into the MIZ as part of ship-supported operations in July, after initial formation and northward retreat of the MIZ.
|

(a) Nortek Acoustic Wave and Current (AWAC) and (b) Waverider moorings. Waveriders may also be deployed in a drifting configuration. |

Graduate student researcher Seth Zippel tests SWIFT performance in arctic waters in advance of planned missions during the Marginal Ice Zone experiments in 2014. |
|
Remote Sensing |
|
|
Modeling |
||||
|
MIZMAS Zhang, Schweiger, and Steele A new coupled ice–ocean Marginal Ice Zone Modeling and Assimilation System (MIZMAS) will enhance the representation of the unique MIZ processes by incorporating a floe size distribution (FSD) and corresponding model improvements.
|
Arctic Cap Nowcast/Forecast System Posey, Allard, Brozena, and Gardner The NRL has developed a 1/12° Arctic Cap Nowcast/Forecast System (ACNFS). The system is a coupled ice–ocean model and consists of the Los Alamos Community Ice CodE (CICE) and the HYbrid Coordinate Ocean Model (HYCOM) and uses the Navy Coupled Ocean Data Assimilation (NCODA) system. The grid resolution for ACNFS is approximately 3.5 km near the North Pole and 6.5 km near 40°N. ACNFS assimilates satellite measurements (altimeter data, SST, and sea ice concentration) as well as in situ SST and temperature and salinity profiles using a 3DVAR assimilation scheme. Currently, ACNFS assimilates DMSP ice concentration (25-km resolution) along the MIZ. ACNFS produces a nowcast and 5-day forecast each day of ice concentration, ice thickness, ice drift, ocean currents, salinity, and temperature fields. |
E-RASM: Eddy-resolving Regional Arctic Climate System Model Maslowski, Roberts, Cassano, and Hughes A fully coupled eddy-resolving regional Arctic climate system model (E-RASM) with an improved ocean–ice–atmosphere boundary layer through data assimilation will be used to address Earth System Model limitations, synthesize the historically available and new expected remotely sensed and in situ data to advance understanding and prediction of arctic sea ice and climate change at hourly to decadal time scales.
|
|
Science and Experiment Plan |
|||||||||||||||||||
|
|||||||||||||||||||
|
MIZ Publications |
||||||||||||||||||||||||||||||||||||||||||||||||||||||||||||||||||||||||||||||||||||||||||||||||||||||||||||||||||||||||||||||||||||||||||||||||||||||||||||||||||||||||||||||||||||||||||||||||||||||||||||||||||||||||||||||||||||||||||||||||||||||||||||||||||||||||||
|
||||||||||||||||||||||||||||||||||||||||||||||||||||||||||||||||||||||||||||||||||||||||||||||||||||||||||||||||||||||||||||||||||||||||||||||||||||||||||||||||||||||||||||||||||||||||||||||||||||||||||||||||||||||||||||||||||||||||||||||||||||||||||||||||||||||||||
|
References |
|
Asplin, M.G., R. Galley, D.G. Barber, and S. Prinsenburg, 2012. Fracture of summer perennial sea ice by ocean swell as a result of Arctic storms. J. Geophys. Res., 117, C06025, doi:10.1029/2011JC007221. Barber, D.G., R. Galley, M.G. Asplin, R. De Abreu, K.-A. Warner, M. Pućko, M. Gupta, S. Prinsenberg, and S. Julien, 2009. Perennial pack ice in the southern Beaufort Sea was not as it appeared in the summer of 2009. Geophys. Res. Lett., 36, L24501, doi:10.1029/2009GL041434. Bitz, C.M., 2008. Some aspects of uncertainty in predicting sea ice retreat. In Arctic Sea Ice Decline: Observations, Projections, Mechanisms, and Implications, edited by E.T. DeWeaver, C.M. Bitz, and L.B. Tremblay. Geophysical Monograph Series 180, American Geophysical Union: Washington, D.C., pp. 63–76. CRST, 1980. Proceedings, Intl. Workshop on the Seasonal Ice Zone, Monterey, California, 26 February – 1 March 1979, edited by B.G. Andersen, W.F. Weeks, and J.L. Newton. Cold Regions Sci. Technol., 2, 357 pp. Doble, M.J., 2010. Ocean waves in sea ice: Determining ice thickness between intermittently-recording buoys. International Glaciology Society Symposium on Sea Ice in the Physical and Biochemical System, Tromso, Norway, 31 May – 4 June. Dorn, W., K. Dethloff, A. Rinke, S. Frickenhaus, R. Gerdes, M. Karcher, and F. Kauker, 2007. Sensitivities and uncertainties in a coupled regional atmosphere–ocean–ice model with respect to the simulation of Arctic sea ice. J. Geophys. Res., 112, D10118, doi:10.1029/2006JD007814. Dumont, D., A. Kohout, and L. Bertino, 2011. A wave-based model for the marginal ice zone including a floe breaking parameterization. J. Geophys. Res., 116, C04001, doi:10.1029/2010JC006682. Gerdes, R., 2006. Atmospheric response to changes in Arctic sea ice thickness. Geophys. Res. Lett., 33, L18709, doi:10.1029/2006GL027146. Giorgi, F., 2005. Climate change prediction. Clim. Change, 73, 239–265. Girard, L., J. Weiss, J.M. Molines, B. Barnier, and S. Bouillon, 2009. Evaluation of high-resolution sea ice models on the basis of statistical and scaling properties of Arctic sea ice drift and deformation. J. Geophys. Res., 114, C08015, doi: 10.1029/2008JC005182. GSP Group, 1990. Greenland Sea Project. A venture toward improved understanding of the oceans’ role in climate. EOS, Trans. AGU, 71(24), 750–755. Guest, P.S., and K.L. Davidson, 1987. The effect of observed ice conditions on the drag coefficient in the summer East Greenland Sea marginal ice zone. J. Geophys. Res., 92, 6987–7011. Hakkinen, S., 1987. A coupled dynamic-thermodynamic model of an ocean–ice system in the marginal ice zone. J. Geophys. Res., 92, 9469–9478. Hibler, W.D., 1979. A dynamic thermodynamic sea ice model. J. Phys. Oceanogr., 9, 815–846. Holland, M.M., C.M. Bitz, and B. Tremblay, 2006. Future abrupt reductions in the summer Arctic sea ice. Geophys. Res. Lett., 33, L23503, doi:10.1029/2006GL028024. Hunke, E.C., 2010. Thickness sensitivities in the CICE sea ice model. Ocean Mod., 34, 137–149, doi:10.1016/j.ocemod.2010.05.004. Jackson, J.M., E.C. Carmack, F.A. McLaughlin, S.E. Allen, and R.G. Ingram, 2010. Identification, characterization and change of the near-surface temperature maximum in the Canada Basin, 1993–2008. J. Geophys. Res., 115, C05021, doi:10.1029/2009JC005265. Jackson, J.M., S.E. Allen, F.A. McLauglin, R.A. Woodgate, and E.C. Carmack, 2011. Changes to the near-surface waters in the Canada Basin, Arctic Ocean from 1993–2009: A basin in transition. J. Geophys. Res., 116, C10008, doi:10.1029/2011JC007069. JGR, 1983. Marginal Ice Zones. J. Geophys. Res., 88(C5). JGR, 1987. Marginal Ice Zone Research. J. Geophys. Res., 92(C7). JGR, 1991. Marginal Ice Zone Experiment III. J. Geophys. Res., 96(C3). Johannessen, O.M., W.D. Hibler III, P. Wadhams, W.J. Campbell, K. Hasselmann, and I. Dyer, 1983. MIZEX, A Program for Mesoscale Air–Ice–Ocean Interaction Experiments in Arctic Marginal Ice Zones: II. A Plan for a Summer Marginal Ice Zone Experiment in the Fram Strait/Greenland Sea, 1984. U.S. Army Cold Regions Research and Engineering Laboratory, Hanover NH, Special Report 83-12, 47 pp. Johannessen, O.M., and S. Sandven, 1989. SIZEX’89; A Prelaunch ERS-1 Experiment. NERSC Technical Report 23, Bergen. See also Johannessen, O.M. and 17 others, 1992. SIZEX’92, An ERS-1 Geophysical Validation, Science and Application Program. NERSC Technical Report. Krinner, G., A. Rinke, K. Dethloff, and I.V. Gorodetskaya, 2010. Impact of prescribed Arctic sea ice thickness in simulations of the present and future climate. Clim. Dyn., 35(4), 619–633. Kwok, R., and D.A. Rothrock, 2009. Decline in Arctic sea ice thickness from submarine and ICESat records: 1958–2008. Geophys. Res. Lett., 36, doi:10.1029/2009GL039035. Maslanik, J.A., C. Fowler, J. Stroeve, S.D. Robot, J. Zwally, D. Yi, and W. Emery, 2007. A younger, thinner Arctic ice cover: Increased potential for rapid, extensive sea-ice loss. Geophys. Res. Lett., 34, L24501, doi:10.1029/2007GL032043. Maslowski W., J. Clement Kinney, M. Higgins, and A. Roberts, 2012. The future of Arctic sea ice. Annu. Rev. Earth Planet. Sci., 40, 625–654, doi:10.1146/annurev-earth-042711-105345. McNutt, L., and seven others, 1988. LIMEX’87: The Labrador Ice Margin Experiment, March 1987; A pilot experiment in anticipation of RADARSAT and ERS-1 data. EOS, Trans. AGU, 69(23), 634. McPhee, M.G., 1983. Greenland Sea ice/ocean margin. EOS, Trans. AGU, 64(9), 82. McPhee, M.G., and T. P. Stanton, 1996. Turbulence in the statically unstable oceanic boundary layer under arctic leads. J. Geophys. Res., 101(C3), 6409–6428. MIZEX Bulletins, 1983-1986. MIZEX: A Program for Mesoscale Air–Ice–Ocean Interaction Experiments in Arctic Marginal Ice Zones, edited by P. Wadhams and W.D. Hibler III. CRREL Special Reports: (numbering system Bulletin/Special Report) I =81-19, II=83-12, III=84-7, IV=84-28, V=84-29, VI=85-6, VII=86-3. (I and II were science plans.) Of special interest:
MIZEX-West, edited by P. Wadhams. MIZEX Bull. VIII (1986). Science plan for a winter marginal ice zone experiment in the Fram Strait/Greenland Sea 1987–1989, edited by K. Davidson et al. MIZEX Group (33 authors), 1986. MIZEX East: The Summer Marginal Ice Zone Program in the Fram Strait/Greenland Sea. EOS, Trans. AGU, 67(23), 513–517. MIZEX-West Study Group, 1983. MIZEX West: Bering Sea marginal ice zone experiment. EOS, Trans. AGU, 64(40), 578–579. Morison, J.H., M.G. McPhee, and G.A. Maykut, 1987. Boundary-layer, upper ocean, and ice observations in the Greenland Sea marginal ice-zone. J. Geophys. Res., 92, 6987–7011. Perovich, D.K., W. Meier, J. Maslanik, and J. Richter-Menge, 2012. Sea ice cover [in State of the Climate in 2011]. Bull. Amer. Meteor. Soc., 3(7), S140–S142. Proshutinsky, A. and 19 others, 2011. Ocean [in Arctic Report Card 2011]. http://www.arctic.noaa.gov/reportcard. Rainville, L., and R.A. Woodgate, 2009. Observations of internal wave generation in the seasonally ice-free Arctic, Geophys. Res. Lett., 36, L23604, doi:10.1029/2009GL041291. Rampal, P., J. Weiss, and D. Marsan, 2009. Positive trend in the mean speed and deformation rate of Arctic sea ice: 1979–2007. J. Geophys. Res., 114, C05013, doi:10.1029/2008JC005066. Raney, R.K., S. Digby-Argus, and L. McNutt, 1989. LIMEX’89 – an overview. Proceeding, International Geoscience and Remote Sensing Symposium (IGARSS’89), 10–14 July, Ottawa, Ontario, 1517–1519. Rind, D., 2008. The consequences of not knowing low- and high-latitude climate sensitivity. Bull. Am. Meteorol. Soc., 89, 855–864. Rind, D., R. Healy, C. Parkinson, and D. Martinson, 1996. The role of sea ice in 2xCO2 climate model sensitivity. Part I: The total influence of sea ice thickness and extent. J. Clim., 8, 449–463. Rinke A., K. Dethloff, J. Cassano, J.H. Christensen, J.A. Curry, et al., 2006. Evaluation of an ensemble of Arctic regional climate models: Spatiotemporal fields during the SHEBA year. Clim. Dyn., 26, 459–472. Schweiger, A., R. Lindsay, J. Zhang, M. Steele, H. Stern, and R. Kwok, 2011. Uncertainty in modeled Arctic sea ice volume, J. Geophys. Res. 116, doi:10.1029/2011JC007084. Shaw, W.J., T.P. Stanton, M.G. McPhee, J.H. Morison, and D.G. Martinson, 2009. The role of the upper ocean in the surface heat budget of the Arctic Ocean. J. Geophys. Res., 114, doi: 10.1029/2008JC004991. Shimada, K., T. Kamoshida, M. Itoh, S. Nishino, E. Carmack, F. McLaughlin, S. Zimmermann, and A. Proshutinsky, 2006. Pacific Ocean inflow: Influence on catastrophic reduction of sea ice cover in the Arctic Ocean. Geophys. Res. Lett., 33, L08605, doi:10.1029/2005GL025624. Squire, V.A., 2007. Of ocean waves and sea-ice revisited. Cold Reg. Sci. Technol., 49, 110–133. Stanton, T.P., W.J. Shaw, and J. Hutchings, 2012. Variability of summertime ocean-to-ice heat flux in the Transpolar Drift: 2002–2010. J. Geophys. Res., 117, C07005, doi:10.1029/2011JC007871. Toole, J.M., M.-L. Timmermans, D.K. Perovich, R.A. Krishfield, A. Proshutinsky, and J. A. Richter-Menge, 2010. Influences of the ocean surface mixed layer and thermohaline stratification on Arctic Sea ice in the central Canada Basin. J. Geophys. Res., 115, C10018, doi:10.1029/2009JC005660. Untersteiner, N., and 14 others, 1983. Air-Sea-Ice Research Program for the 1980s. Scientific Plan 1983. Applied Physics Laboratory, University of Washington, Technical Report APL-UW 8306, Seattle, WA, 88 pp. U.S. Navy, 2009. Arctic Roadmap. Washington, D.C.: U.S. Navy, Task Force Climate Change, Oceanographer of the Navy, 30 pp. Wadhams, P., 1973. Attenuation of swell by sea ice, J. Geophys. Res., 78(18), 3552–3563, doi:10.1029/JC078i018p03552. Wadhams, P., 2000. Ice in the Ocean. Amsterdam: Gordon and Breach, 364 pp. Wadhams, P., and M.J. Doble, 2009. Sea ice thickness measurement using episodic infragravity waves from distant storms. Cold Reg. Sci. Technol., 56, 98–101. Wadhams, P., S. Martin, O.M. Johannessen, W.D. Hibler III, and W.J. Campbell, 1981. MIZEX, A Program for Mesoscale Air–Ice-Ocean Interaction Experiments in Arctic Marginal Ice Zones: I. Research Strategy. U.S. Army Cold Regions Research and Engineering Laboratory, Hanover NH, Special Report 81-19, 20 pp. Wadhams, P., V.A. Squire, J.A. Ewing, and R.W. Pascal, 1986. The effect of the marginal ice zone on the directional wave spectrum of the ocean. J. Phys. Oceanogr., 6(2), 358–376. Wadhams, P., V.A. Squire, D.J. Goodman, A.M. Cowan and S.C. Moore, 1988. The attenuation rates of ocean waves in the marginal ice zone. J. Geophys. Res., 93(C6), 6799–6818. Wadhams, P., J.-C. Gascard, and L. Miller, editors, 1999. The European Subpolar Ocean Programme: ESOP. Deep-Sea Res., 46(6-7), 1011–1530. Wang, M., and J.E. Overland, 2009. A sea ice free summer Arctic within 30 years? Geophys. Res. Lett., 36, L07502, doi:10.1029/2009GL037820. Washington W.M., and G.A. Meehl, 1996. High-latitude climate change in a global coupled ocean–atmosphere–sea ice model with increased atmospheric CO2. J. Geophys. Res., 101, 12,795–12,801. Weeks, W.F., 2010. On Sea Ice. Fairbanks, Alaska: University of Alaska Press, 664 pp. Wilkinson, J.P., S. Hanson, N.E. Hughes, A. James, B. Jones, R. MacKinnon, S. Rysgaard, and L. Toudal, 2011. Tradition and technology: Sea ice science on Inuit sleds. Eos, Trans. AGU, 92(1), 1, doi:10.1029/2011EO010002. Wilkinson, J.P., P.M. Wadke, D. Meldrum, D. Mercer, M. Doble, and P. Wadhams, 2008. The autonomous measurement of waves propagating across the Arctic Ocean. Proceedings, OCEANS 2007, Vancouver, British Columbia, 29 September – 4 October, 1435-1441 (IEEE/MTS). Woodgate, R.A., T. Weingartner, and R. Lindsay, 2010. The 2007 Bering Strait oceanic heat flux and anomalous Arctic sea ice retreat. Geophys. Res. Lett., 37, L01602, doi:10.1029/2009GL041621. Zhang, X.D., and J.E. Walsh, 2006. Toward a seasonally ice-covered Arctic Ocean: Scenarios from the IPCC AR4 model simulations. Clim. J., 19, 1730–1747. Zhang, J., M. Steele, R.W. Lindsay, A. Schweiger, and J. Morison, 2008. Ensemble one-year predictions of arctic sea ice for the spring and summer of 2008. Geophys. Res. Lett., 35, L08502, doi:10.1029/2008GL033244. |
|
MIZ Collaboratory on Google Drive |
|
As of 18 August 2015 the Collaboratory is hosted by Google Drive. |
|
WorkSpace |
Resources |
|
|
The MIZ Collaboratory hosted by Google Drive is divided into two sections. The WorkSpace is open for all collaborators to read and write documents, presentations, images, and data. Changes made to files and directories in the WorkSpace will propagate to all copies of the MIZ Collaboratory on Google Drive. This means that if you delete a file in the cloud or in your local copy of the drive, it will disappear from all other copies. Please be considerate when using the Collaboratory. Files will be backed up regularly, but we’d prefer to avoid the labor of restoration. |
The Resources directory is open for all collaborators to read and download archived documents, presentations, images, and data. The Resources directory holds relatively stable assets, such as data sets and archived presentations, to make them easily accessible by all collaborators while being protected from accidental deletion. To place material into the Resources directory, upload to the WorkSpace and contact Craig Lee with a request to move the files to Resources. |
|
Getting Started |
|
If you were accessing the Collaboratory hosted by Catalyst with a UWNetID account, continue to use that account to access the MIZ Collaboratory on Google Drive (making sure that you have registered your account with UW Google Apps). Likewise, if you were using a Gmail account to access the Collaboratory on Catalyst, continue to use that Gmail user account to access the MIZ Collaboratory on Google Drive. |
|
UWNetID Users |
Gmail Users |
|
|
For Collaborators with University of Washington UWNetID accounts:
|
For Collaborators with Gmail accounts:
|
|
Communications from Scientists & Engineers in the Field |
||
|
3 August 2014
|
2 August 2014
|
|
1 August 2014
|
31 July 2014
|
30 July 2014
|
|
29 July 2014
|
28 July 2014
|
27 July 2014
|
|
26 July 2014
|
25 July 2014
|
24 July 2014
Tomorrow:
|
|
24 March 2014 Today's activities:
23 March 2014 Today's activities:
Tomorrow:
|
20 March 2014 Today's activities:
Tomorrow:
|
19 March 2014 Today's activities:
Tomorrow:
|
|
18 March 2014 Today's activities:
Tomorrow:
|
16 March 2014 Today's activities:
Camp positions:
Plan:
|
15 March 2014 Today's activities:
Plan:
|
|
13 and 14 March 2014 Today's activities:
Latest camp positions:
Outlook:
|
12 March 2014 Today's activities:
Tomorrow's plan:
|
11 March 2014 Today's activities:
Outlook:
|
|
9 March 2014 Today's activity:
Tomorrow's plan
8 March 2014 Today's activity:
Outlook:
|
6 March 2014 Today's activity:
Outlook
5 March 2014 Today's activity:
Outlook:
|
4 March 2014
To do:
2 March 2014
|


